
|
Test Results for Chamber M3R4-109 |
|
| Chamber M3R4 |
Chamber Bar Code |
FEBs Bar Codes |
Date Dressing | Comments |
|---|---|---|---|---|
| 109 | 4UAPNB03400109 | 4UE20900113387
4UE20900113462 4UE20900113813 |
04-JUL-07 | Chamber is in the Pit |
| Chamber | Gas Leak [mb/hour] |
Test Date | Comments |
|---|---|---|---|
| 109 | .1 | Relative methode |
| Chamber | 2.4 kV | 2.5 kV | 2.6 kV | 2.7 kV | 2.8 kV | 2.9 kV | Test Date | Comments |
|---|---|---|---|---|---|---|---|---|
| 109 | 15-FEB-06 | Shorts on Gap2, Pads 13-15 |
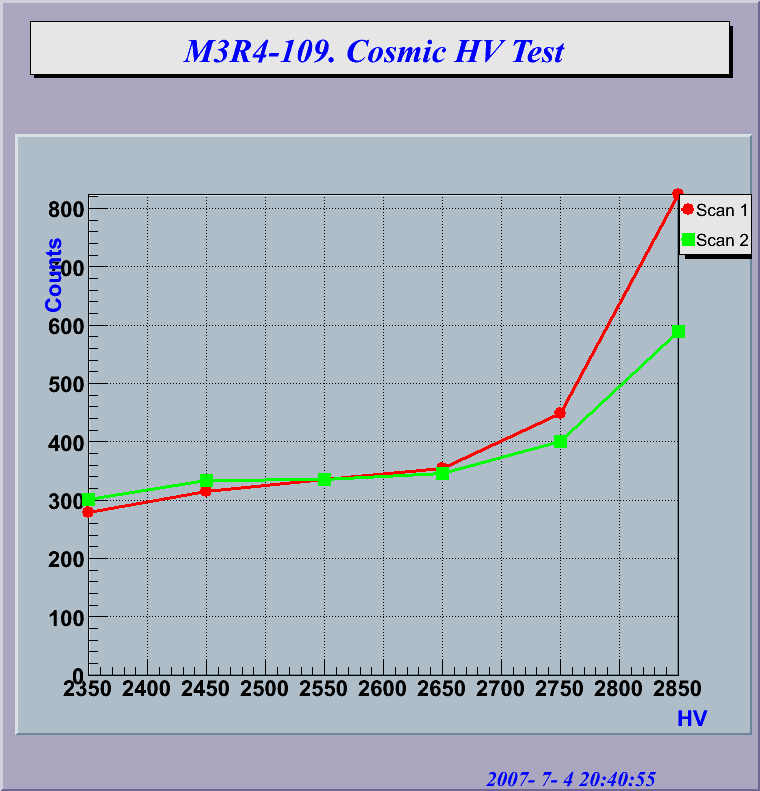
| Chamber | Scan | 2.35 kV | 2.45 kV | 2.55 kV | 2.65 kV | 2.75 kV | 2.85 kV | Date | Plot | Comments |
|---|---|---|---|---|---|---|---|---|---|---|
| 109 | 1 2 |
278 300 |
315 332 |
335 335 |
354 344 |
448 400 |
824 588 |
04-JUL-07 |
 |
 |
 |
| Fig.1 Counts/300s averaged over 24 pads. AB&CD. Scan1: HV(AB)=2550V Scan2: HV(CD)=2550V |
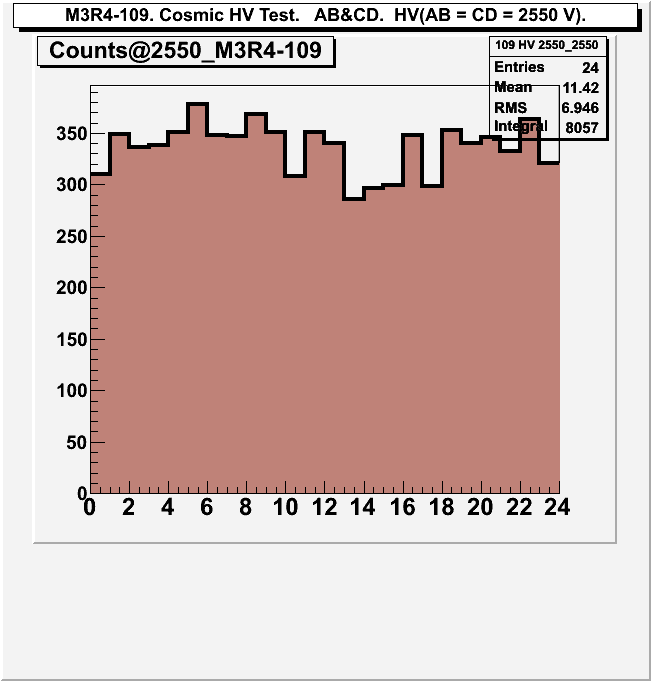
Fig.2 Counts distribution in 24 pads. AB&CD. HV(AB)=HV(CD)= 2550 V |
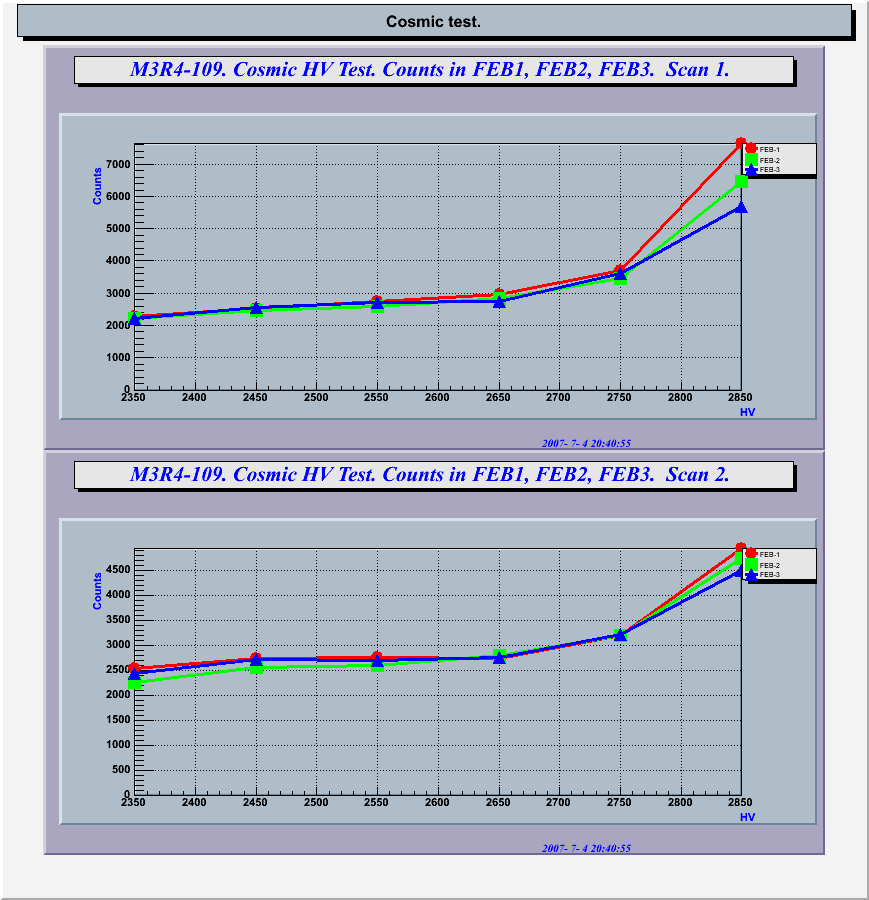
Fig.3 Counts/300s averaged over 8 pads in FEB1, FEB2, FEB3. AB&CD Scan1: HV(AB)=2550V Scan2: HV(CD)=2550V |
| HV(ON) | HV(OFF) | Chamber | HV(A)=2550 GapAB |
HV(B)=2550 GapAB |
HV(C)=2550 GapCD |
HV(D)=2550 GapCD |
Thr=8.5fC | Thr=10fC | Atm.Pres. | Date | Plots | Status |
|---|---|---|---|---|---|---|---|---|---|---|
| 109 | 446.2 | 467.7 | 537.6 | 534.8 | 2094.8 | 81.2 | Pa= 965.9 mb | 04-JUL-07 | ||
 |
 |
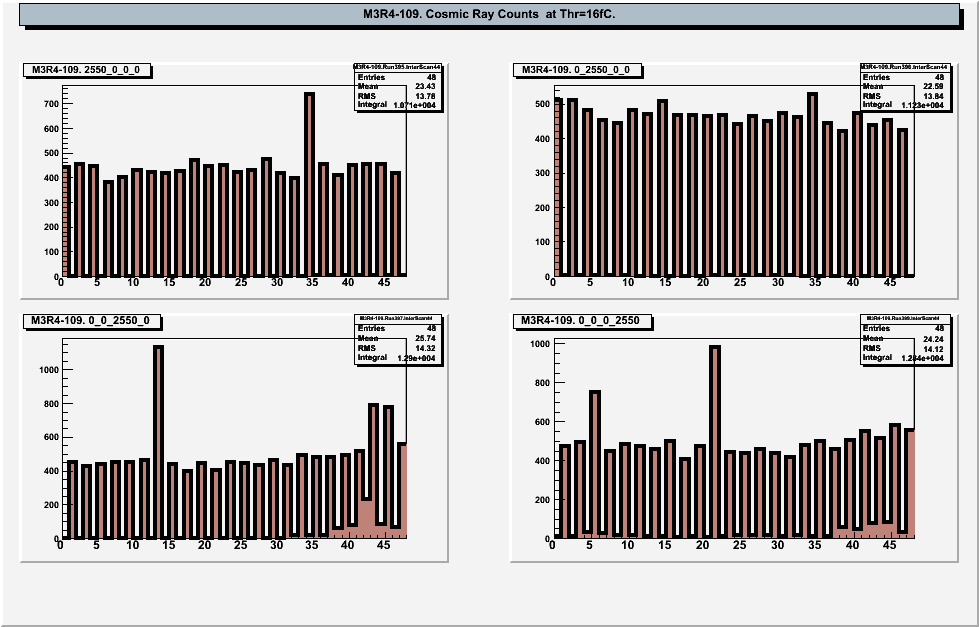
| Fig.1 Counts distribution over pads in bi-gap AB (odd channels)
and in bi-gap CD (even channels) at various HV combinations: Left_Up: HV(A)=2550V; HV(B,C,D)=0; Right_Up: HV(B)=2550V; HV(A,C,D)=0; Left_Down: HV(C)=2550V; HV(A,B,D)=0; Right_Down: HV(D)=2550V; HV(A,B,C)=0; Thr=16fC in all channels. Measurements time 100 sec. |
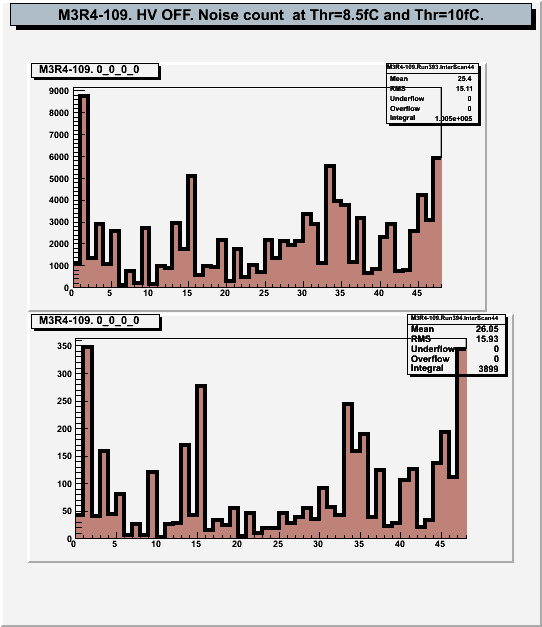
Fig.2 Counts distribution over pads in bi-gap AB (odd channels)
and bi-gap CD (even channels) at HV=0 in all gaps Thr=8.5fC (upper plot) and in Thr=10fC (down plot) in all channels. Measurements time 1 sec. |
| FEB-1. Mean values. | FEB-2. Mean values. | FEB-3. Mean values. | ||||||||||
|---|---|---|---|---|---|---|---|---|---|---|---|---|
| Chamber |
Thr_Max [r.u.] |
N_Max [counts/s] |
D_100 [r.u.] |
Thr_Max [r.u.] |
N_Max [counts/s] |
D_100 [r.u.] |
Thr_Max [r.u.] |
N_Max [counts/s] |
D_100 [r.u.] |
Test Date | Plots | Comments | 109 | 82 | 422567 | 12 | 75 | 372993 | 12 | 81 | 438620 | 13 | 04-JUL-07 |
| FEB Channels |
Ch_1 | Ch_2 | Ch_3 | Ch_4 | Ch_5 | Ch_6 | Ch_7 | Ch_8 | Ch_9 | Ch_10 | Ch_11 | Ch_12 | Ch_13 | Ch_14 | Ch_15 | Ch_16 |
|---|---|---|---|---|---|---|---|---|---|---|---|---|---|---|---|---|
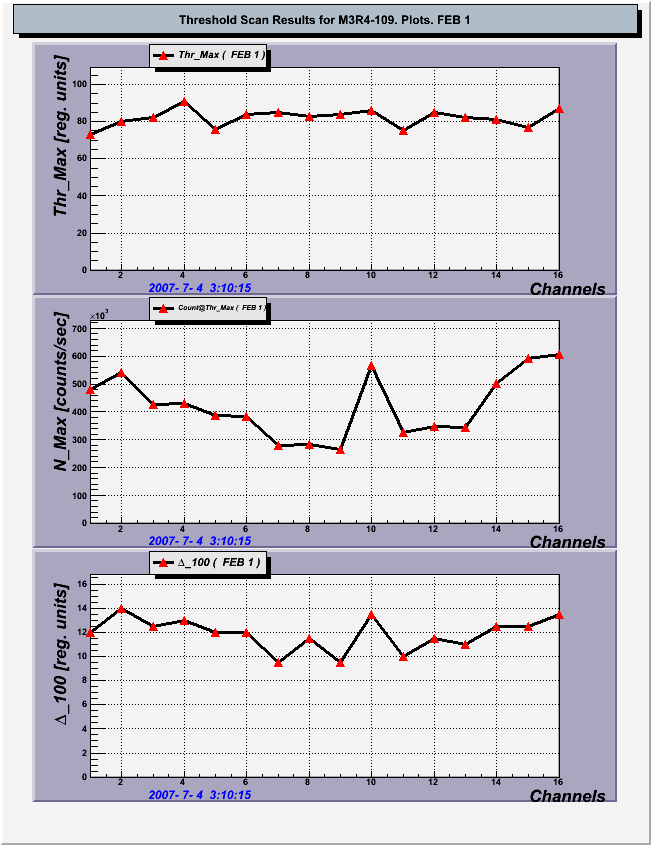
| FEB-1 | 73 | 80 | 82 | 91 | 76 | 84 | 85 | 83 | 84 | 86 | 75 | 85 | 82 | 81 | 77 | 87 |
| FEB-2 | 86 | 72 | 84 | 87 | 70 | 81 | 70 | 82 | 74 | 73 | 66 | 79 | 63 | 70 | 72 | 76 |
| FEB-3 | 85 | 88 | 80 | 80 | 74 | 74 | 85 | 74 | 86 | 81 | 82 | 77 | 86 | 80 | 80 | 86 |
| FEB Channels |
Ch_1 | Ch_2 | Ch_3 | Ch_4 | Ch_5 | Ch_6 | Ch_7 | Ch_8 | Ch_9 | Ch_10 | Ch_11 | Ch_12 | Ch_13 | Ch_14 | Ch_15 | Ch_16 |
|---|---|---|---|---|---|---|---|---|---|---|---|---|---|---|---|---|
| FEB-1 | 481080 | 542690 | 427211 | 428966 | 388272 | 384213 | 277736 | 282070 | 265637 | 567394 | 324831 | 346061 | 343356 | 502328 | 591685 | 607548 |
| FEB-2 | 303601 | 554220 | 247758 | 399804 | 259097 | 320524 | 343871 | 323151 | 275231 | 443392 | 389106 | 339179 | 362357 | 369918 | 481296 | 555384 |
| FEB-3 | 399910 | 523644 | 433280 | 423297 | 358833 | 456957 | 365249 | 302007 | 408421 | 499315 | 328761 | 404576 | 503550 | 431583 | 497076 | 681453 |
| FEB Channels |
Ch_1 | Ch_2 | Ch_3 | Ch_4 | Ch_5 | Ch_6 | Ch_7 | Ch_8 | Ch_9 | Ch_10 | Ch_11 | Ch_12 | Ch_13 | Ch_14 | Ch_15 | Ch_16 |
|---|---|---|---|---|---|---|---|---|---|---|---|---|---|---|---|---|
| FEB-1 | 12 | 14 | 13 | 13 | 12 | 12 | 10 | 12 | 10 | 14 | 10 | 12 | 11 | 13 | 13 | 14 |
| FEB-2 | 11 | 12 | 11 | 13 | 11 | 12 | 11 | 12 | 12 | 12 | 11 | 12 | 12 | 10 | 13 | 11 |
| FEB-3 | 12 | 14 | 13 | 13 | 12 | 13 | 11 | 11 | 13 | 13 | 12 | 12 | 13 | 12 | 13 | 13 |
 |
 |
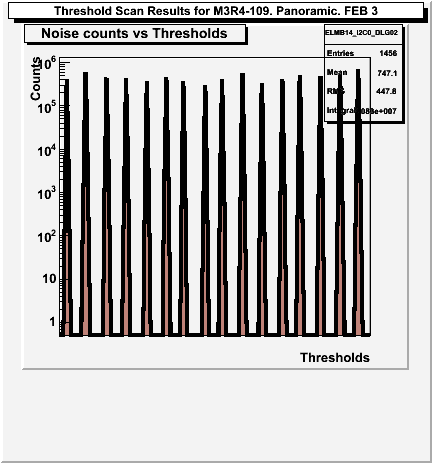 |
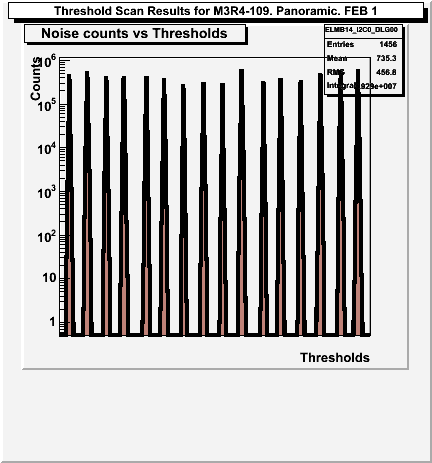
| Noise rates vs Thresholds for FEB-1 | Noise rates vs Thresholds for FEB-2 | Noise rates vs Thresholds for FEB-3 |
 |
 |
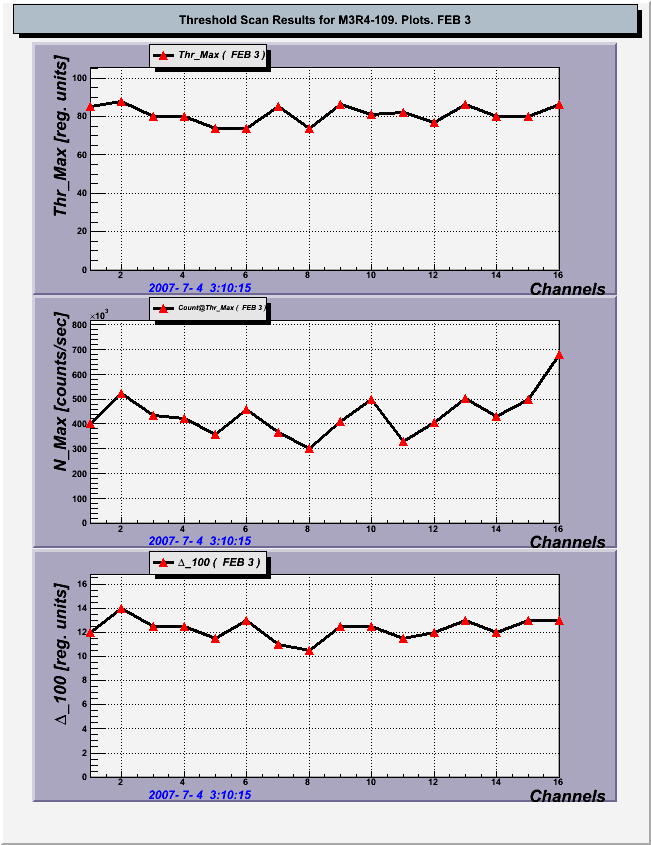 |
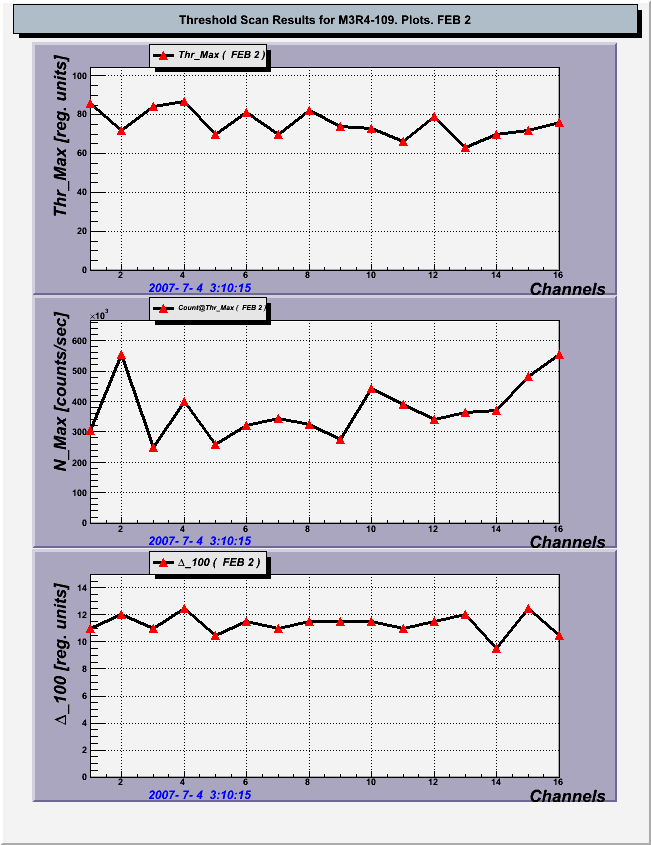
| Scan results for FEB-1 (left plots), for FEB-2 (middle plots), for FEB-3 (right plots). Thr_Max vs channel number (upper plot) N_Max vs channel number (middle plot) D_100 vs channel number (lower plot) | ||
|---|---|---|