
|
Test Results for Chamber M3R4-190 |
|
| Chamber M3R4 |
Chamber Bar Code |
FEBs Bar Codes |
Date Dressing | Comments |
|---|---|---|---|---|
| 190 | 4UAPNB03400190 | 4UE20900111963
4UE20900111907 4UE20900111859 |
14-DEC-06 | Chamber is in the Pit |
| Chamber | Gas Leak [mb/hour] |
Test Date | Comments |
|---|---|---|---|
| 190 | .1 | Relative methode |
| Chamber | 2.4 kV | 2.5 kV | 2.6 kV | 2.7 kV | 2.8 kV | 2.9 kV | Test Date | Comments |
|---|---|---|---|---|---|---|---|---|
| 190 | 2 | 4 | 4 | 4 | 7 | 14 | 27-JAN-06 | T=20.5C, H=23%, P=963mbar |
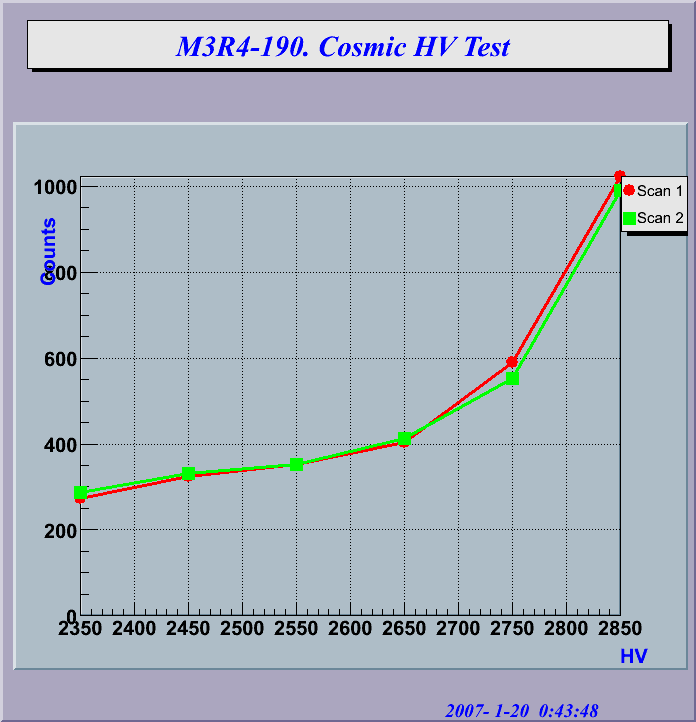
| Chamber | Scan | 2.35 kV | 2.45 kV | 2.55 kV | 2.65 kV | 2.75 kV | 2.85 kV | Date | Plot | Comments |
|---|---|---|---|---|---|---|---|---|---|---|
| 190 | 1 2 |
272 288 |
325 330 |
352 352 |
403 413 |
590 552 |
1021 990 |
20-JAN-07 |
 |
 |
 |
| Fig.1 Counts/300s averaged over 24 pads. AB&CD. Scan1: HV(AB)=2550V Scan2: HV(CD)=2550V |
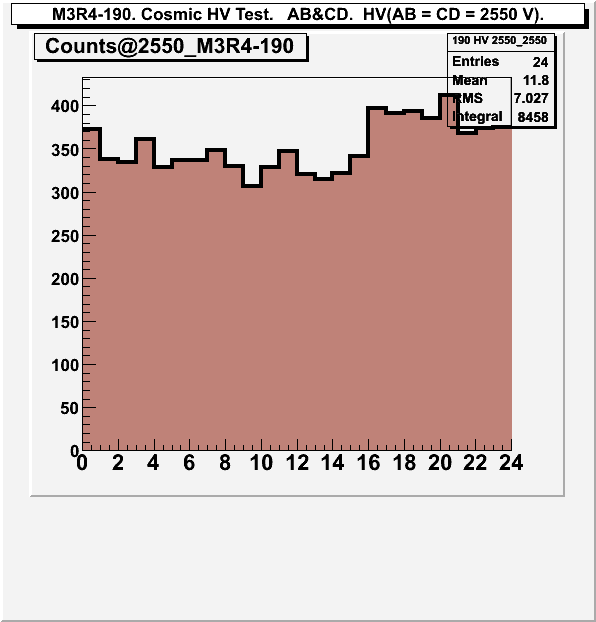
Fig.2 Counts distribution in 24 pads. AB&CD. HV(AB)=HV(CD)= 2550 V |
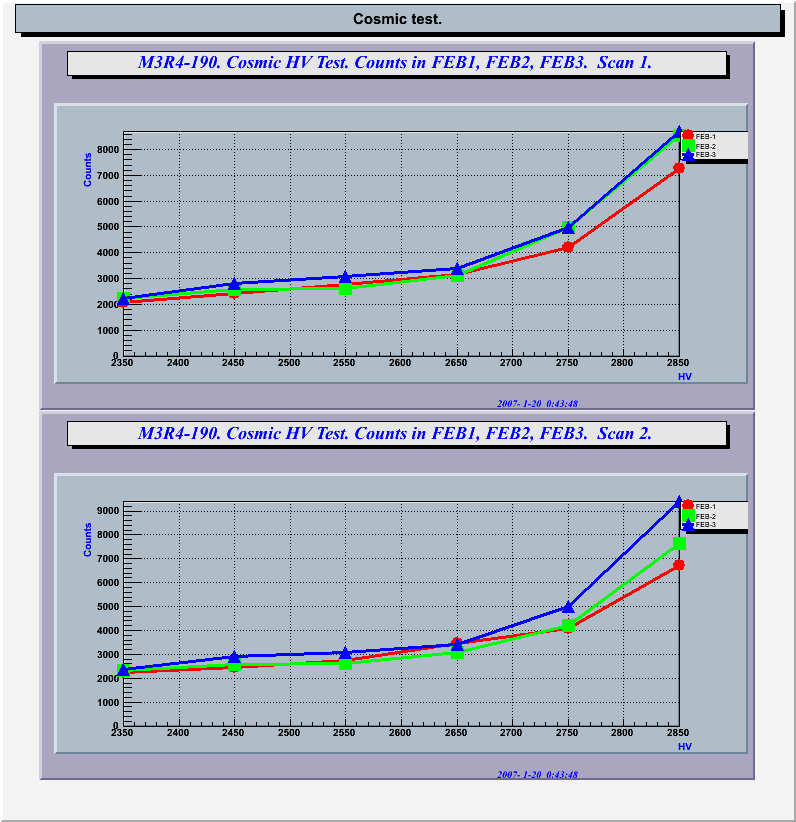
Fig.3 Counts/300s averaged over 8 pads in FEB1, FEB2, FEB3. AB&CD Scan1: HV(AB)=2550V Scan2: HV(CD)=2550V |
| HV(ON) | HV(OFF) | Chamber | HV(A)=2550 GapAB |
HV(B)=2550 GapAB |
HV(C)=2550 GapCD |
HV(D)=2550 GapCD |
Thr=12fC | Thr=12fC | Atm.Pres. | Date | Plots | Status |
|---|---|---|---|---|---|---|---|---|---|---|
| 190 | 550.1 | 1495.2 | 441.3 | 440.3 | .9 | .9 | Pa=970.7 mb | 19-JAN-07 | ||
 |
 |
| Fig.1 Counts distribution over pads in bi-gap AB (odd channels)
and in bi-gap CD (even channels) at various HV combinations: Left_Up: HV(A)=2550V; HV(B,C,D)=0; Right_Up: HV(B)=2550V; HV(A,C,D)=0; Left_Down: HV(C)=2550V; HV(A,B,D)=0; Right_Down: HV(D)=2550V; HV(A,B,C)=0; Thr=16fC in all channels. Measurements time 100 sec. |
Fig.2 Counts distribution over pads in bi-gap AB (odd channels)
and bi-gap CD (even channels) at HV=0 in all gaps Thr=12fC (upper plot) and in Thr=12fC (down plot) in all channels. Measurements time 1 sec. |
| FEB-1. Mean values. | FEB-2. Mean values. | FEB-3. Mean values. | ||||||||||
|---|---|---|---|---|---|---|---|---|---|---|---|---|
| Chamber |
Thr_Max [r.u.] |
N_Max [counts/s] |
D_100 [r.u.] |
Thr_Max [r.u.] |
N_Max [counts/s] |
D_100 [r.u.] |
Thr_Max [r.u.] |
N_Max [counts/s] |
D_100 [r.u.] |
Test Date | Plots | Comments | 190 | 70 | 275277 | 10 | 81 | 375618 | 11 | 74 | 486130 | 13 | 19-JAN-07 | Sens=7.5mV/fc Th=15fc |
| FEB Channels |
Ch_1 | Ch_2 | Ch_3 | Ch_4 | Ch_5 | Ch_6 | Ch_7 | Ch_8 | Ch_9 | Ch_10 | Ch_11 | Ch_12 | Ch_13 | Ch_14 | Ch_15 | Ch_16 |
|---|---|---|---|---|---|---|---|---|---|---|---|---|---|---|---|---|
| FEB-1 | 71 | 77 | 69 | 74 | 75 | 81 | 73 | 72 | 66 | 72 | 64 | 70 | 62 | 68 | 59 | 68 |
| FEB-2 | 81 | 92 | 84 | 75 | 81 | 79 | 73 | 87 | 84 | 83 | 82 | 78 | 79 | 83 | 79 | 74 |
| FEB-3 | 73 | 63 | 78 | 70 | 74 | 68 | 71 | 76 | 71 | 76 | 74 | 75 | 73 | 79 | 85 | 70 |
| FEB Channels |
Ch_1 | Ch_2 | Ch_3 | Ch_4 | Ch_5 | Ch_6 | Ch_7 | Ch_8 | Ch_9 | Ch_10 | Ch_11 | Ch_12 | Ch_13 | Ch_14 | Ch_15 | Ch_16 |
|---|---|---|---|---|---|---|---|---|---|---|---|---|---|---|---|---|
| FEB-1 | 233493 | 637593 | 206128 | 257598 | 161380 | 214269 | 215870 | 297272 | 141114 | 206852 | 265416 | 351198 | 206262 | 445111 | 246855 | 318022 |
| FEB-2 | 392967 | 543772 | 214341 | 586392 | 363018 | 373172 | 252319 | 519351 | 217036 | 397642 | 220883 | 321990 | 287836 | 394045 | 425096 | 500029 |
| FEB-3 | 529605 | 557879 | 492859 | 476449 | 489211 | 391292 | 433778 | 373385 | 408116 | 401428 | 386534 | 626290 | 508098 | 492995 | 644393 | 565771 |
| FEB Channels |
Ch_1 | Ch_2 | Ch_3 | Ch_4 | Ch_5 | Ch_6 | Ch_7 | Ch_8 | Ch_9 | Ch_10 | Ch_11 | Ch_12 | Ch_13 | Ch_14 | Ch_15 | Ch_16 |
|---|---|---|---|---|---|---|---|---|---|---|---|---|---|---|---|---|
| FEB-1 | 10 | 13 | 10 | 11 | 10 | 10 | 10 | 10 | 9 | 10 | 9 | 12 | 10 | 12 | 10 | 11 |
| FEB-2 | 11 | 13 | 9 | 12 | 10 | 13 | 10 | 12 | 9 | 13 | 10 | 12 | 11 | 12 | 11 | 13 |
| FEB-3 | 12 | 14 | 12 | 13 | 13 | 13 | 13 | 13 | 13 | 13 | 13 | 14 | 12 | 14 | 13 | 14 |
 |
 |
 |
| Noise rates vs Thresholds for FEB-1 | Noise rates vs Thresholds for FEB-2 | Noise rates vs Thresholds for FEB-3 |
 |
 |
 |
| Scan results for FEB-1 (left plots), for FEB-2 (middle plots), for FEB-3 (right plots). Thr_Max vs channel number (upper plot) N_Max vs channel number (middle plot) D_100 vs channel number (lower plot) | ||
|---|---|---|