
 |
Test Results for Chamber M3R4-24 |
|
| Chamber M3R4 |
Chamber Bar Code |
FEBs Bar Codes |
Date Dressing | Comments |
|---|---|---|---|---|
| 24 | 4UAPNB03400024 | 4UE20900112831
4UE20900114573 4UE20900114685 |
11-JUN-07 | Chamber is in the Pit |
| Chamber | Gas Leak [mb/hour] |
Test Date | Comments |
|---|---|---|---|
| 24 | .1 | Relative methode |
| Chamber | 2.4 kV | 2.5 kV | 2.6 kV | 2.7 kV | 2.8 kV | 2.9 kV | Test Date | Comments |
|---|---|---|---|---|---|---|---|---|
| 24 | 12 | 14 | 16 | 16 | 20 | 25 | 11-OCT-05 | chamber is OK |
| Chamber | Scan | 2.35 kV | 2.45 kV | 2.55 kV | 2.65 kV | 2.75 kV | 2.85 kV | Date | Plot | Comments |
|---|---|---|---|---|---|---|---|---|---|---|
| 24 | 1 2 |
279 291 |
322 316 |
343 343 |
356 358 |
420 493 |
790 716 |
27-JUN-07 |
| HV(ON) | HV(OFF) | Chamber | HV(A)=2550 GapAB |
HV(B)=2550 GapAB |
HV(C)=2550 GapCD |
HV(D)=2550 GapCD |
Thr=8.5fC | Thr=10fC | Atm.Pres. | Date | Plots | Status |
|---|---|---|---|---|---|---|---|---|---|---|
| 24 | 450.8 | 437.8 | 413.8 | 439.9 | 2357.7 | 85.1 | Pa= 962.2 mb | 27-JUN-07 | ||
| FEB-1. Mean values. | FEB-2. Mean values. | FEB-3. Mean values. | ||||||||||
|---|---|---|---|---|---|---|---|---|---|---|---|---|
| Chamber |
Thr_Max [r.u.] |
N_Max [counts/s] |
D_100 [r.u.] |
Thr_Max [r.u.] |
N_Max [counts/s] |
D_100 [r.u.] |
Thr_Max [r.u.] |
N_Max [counts/s] |
D_100 [r.u.] |
Test Date | Plots | Comments | 24 | 75 | 390477 | 12 | 74 | 510683 | 12 | 81 | 464972 | 12 | 27-JUN-07 |
| FEB Channels |
Ch_1 | Ch_2 | Ch_3 | Ch_4 | Ch_5 | Ch_6 | Ch_7 | Ch_8 | Ch_9 | Ch_10 | Ch_11 | Ch_12 | Ch_13 | Ch_14 | Ch_15 | Ch_16 |
|---|---|---|---|---|---|---|---|---|---|---|---|---|---|---|---|---|
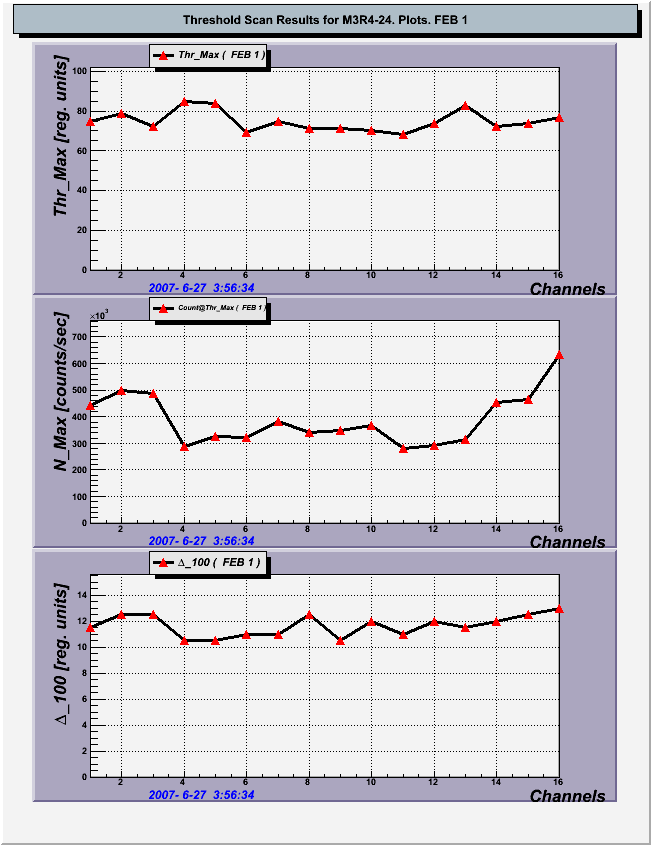
| FEB-1 | 75 | 79 | 72 | 85 | 84 | 69 | 75 | 71 | 71 | 70 | 68 | 74 | 83 | 72 | 74 | 77 |
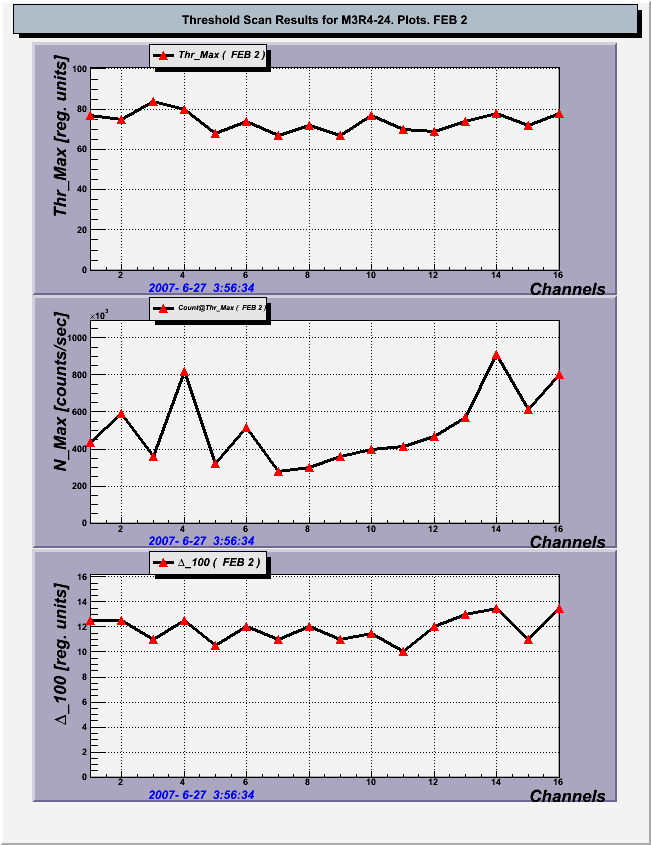
| FEB-2 | 77 | 75 | 84 | 80 | 68 | 74 | 67 | 72 | 67 | 77 | 70 | 69 | 74 | 78 | 72 | 78 |
| FEB-3 | 71 | 89 | 69 | 86 | 81 | 78 | 78 | 79 | 85 | 81 | 84 | 82 | 80 | 81 | 78 | 87 |
| FEB Channels |
Ch_1 | Ch_2 | Ch_3 | Ch_4 | Ch_5 | Ch_6 | Ch_7 | Ch_8 | Ch_9 | Ch_10 | Ch_11 | Ch_12 | Ch_13 | Ch_14 | Ch_15 | Ch_16 |
|---|---|---|---|---|---|---|---|---|---|---|---|---|---|---|---|---|
| FEB-1 | 441804 | 500019 | 487396 | 287922 | 326604 | 322592 | 383492 | 340669 | 347052 | 366194 | 280570 | 293462 | 315226 | 454607 | 464568 | 635453 |
| FEB-2 | 436297 | 591861 | 361640 | 818955 | 324478 | 515194 | 279421 | 302841 | 359519 | 398161 | 414301 | 465834 | 571244 | 911675 | 615670 | 803829 |
| FEB-3 | 413028 | 546473 | 477753 | 631153 | 371525 | 489224 | 360349 | 368907 | 334661 | 487051 | 336296 | 329765 | 448309 | 685697 | 531230 | 628128 |
| FEB Channels |
Ch_1 | Ch_2 | Ch_3 | Ch_4 | Ch_5 | Ch_6 | Ch_7 | Ch_8 | Ch_9 | Ch_10 | Ch_11 | Ch_12 | Ch_13 | Ch_14 | Ch_15 | Ch_16 |
|---|---|---|---|---|---|---|---|---|---|---|---|---|---|---|---|---|
| FEB-1 | 12 | 13 | 13 | 11 | 11 | 11 | 11 | 13 | 11 | 12 | 11 | 12 | 12 | 12 | 13 | 13 |
| FEB-2 | 13 | 13 | 11 | 13 | 11 | 12 | 11 | 12 | 11 | 12 | 10 | 12 | 13 | 14 | 11 | 14 |
| FEB-3 | 13 | 13 | 11 | 12 | 12 | 12 | 12 | 12 | 12 | 12 | 12 | 12 | 14 | 13 | 13 | 12 |
 |
 |
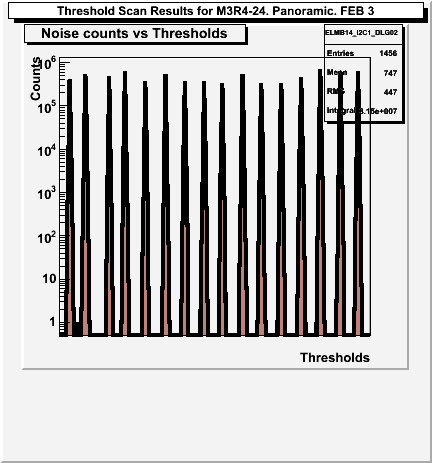 |
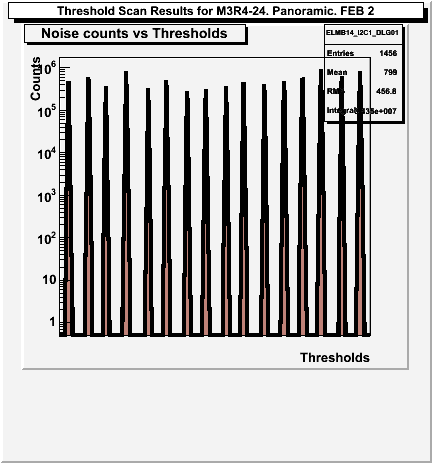
| Noise rates vs Thresholds for FEB-1 | Noise rates vs Thresholds for FEB-2 | Noise rates vs Thresholds for FEB-3 |
 |
 |
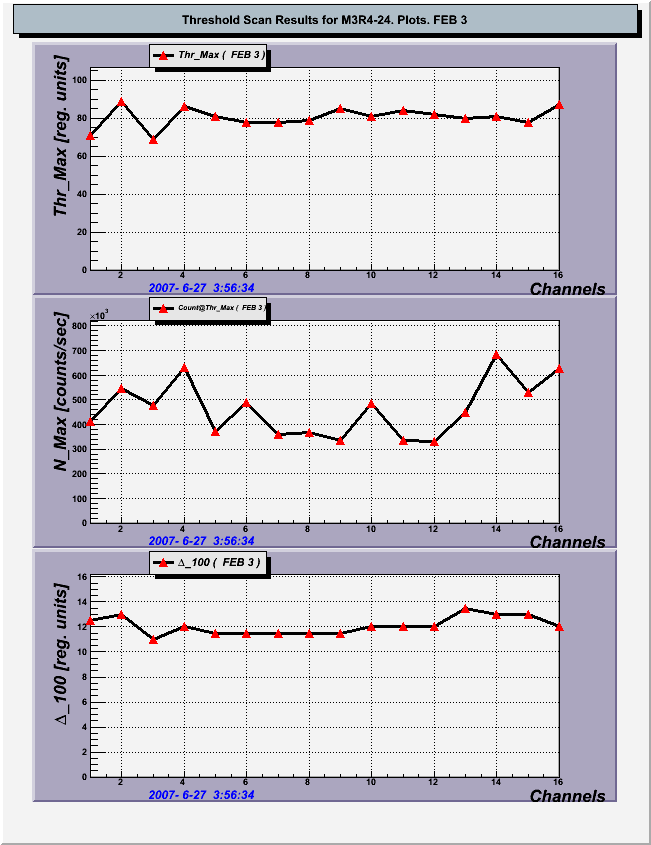 |
| Scan results for FEB-1 (left plots), for FEB-2 (middle plots), for FEB-3 (right plots). Thr_Max vs channel number (upper plot) N_Max vs channel number (middle plot) D_100 vs channel number (lower plot) | ||
|---|---|---|