
|
Test Results for Chamber M3R4-53 |
|
| Chamber M3R4 |
Chamber Bar Code |
FEBs Bar Codes |
Date Dressing | Comments |
|---|---|---|---|---|
| 53 | 4UAPNB03400053 | 4UE20900112563
4UE20900112875 4UE20900112924 |
12-FEB-07 | Chamber is in the Pit |
| Chamber | Gas Leak [mb/hour] |
Test Date | Comments |
|---|---|---|---|
| 53 | .1 | Relative methode |
| Chamber | 2.4 kV | 2.5 kV | 2.6 kV | 2.7 kV | 2.8 kV | 2.9 kV | Test Date | Comments |
|---|---|---|---|---|---|---|---|---|
| 53 | 2 | 4 | 6 | 6 | 6 | 8 | 07-OCT-05 | chamber is OK |
| Chamber | Scan | 2.35 kV | 2.45 kV | 2.55 kV | 2.65 kV | 2.75 kV | 2.85 kV | Date | Plot | Comments |
|---|---|---|---|---|---|---|---|---|---|---|
| 53 | 1 2 |
311 303 |
347 335 |
343 343 |
417 388 |
550 515 |
1041 965 |
09-FEB-07 |
 |
 |
 |
| Fig.1 Counts/300s averaged over 24 pads. AB&CD. Scan1: HV(AB)=2550V Scan2: HV(CD)=2550V |
Fig.2 Counts distribution in 24 pads. AB&CD. HV(AB)=HV(CD)= 2550 V |
Fig.3 Counts/300s averaged over 8 pads in FEB1, FEB2, FEB3. AB&CD Scan1: HV(AB)=2550V Scan2: HV(CD)=2550V |
| HV(ON) | HV(OFF) | Chamber | HV(A)=2550 GapAB |
HV(B)=2550 GapAB |
HV(C)=2550 GapCD |
HV(D)=2550 GapCD |
Thr=8.5 fC | Thr=12 fC | Atm.Pres. | Date | Plots | Status |
|---|---|---|---|---|---|---|---|---|---|---|
| 53 | 459.8 | 478 | 472.6 | 459 | 2262 | .2 | Pa=951.3mb | 09-FEB-07 | ||
 |
 |
| Fig.1 Counts distribution over pads in bi-gap AB (odd channels)
and in bi-gap CD (even channels) at various HV combinations: Left_Up: HV(A)=2550V; HV(B,C,D)=0; Right_Up: HV(B)=2550V; HV(A,C,D)=0; Left_Down: HV(C)=2550V; HV(A,B,D)=0; Right_Down: HV(D)=2550V; HV(A,B,C)=0; Thr=16fC in all channels. Measurements time 100 sec. |
Fig.2 Counts distribution over pads in bi-gap AB (odd channels)
and bi-gap CD (even channels) at HV=0 in all gaps Thr=8.5 fC (upper plot) and in Thr=12 fC (down plot) in all channels. Measurements time 1 sec. |
| FEB-1. Mean values. | FEB-2. Mean values. | FEB-3. Mean values. | ||||||||||
|---|---|---|---|---|---|---|---|---|---|---|---|---|
| Chamber |
Thr_Max [r.u.] |
N_Max [counts/s] |
D_100 [r.u.] |
Thr_Max [r.u.] |
N_Max [counts/s] |
D_100 [r.u.] |
Thr_Max [r.u.] |
N_Max [counts/s] |
D_100 [r.u.] |
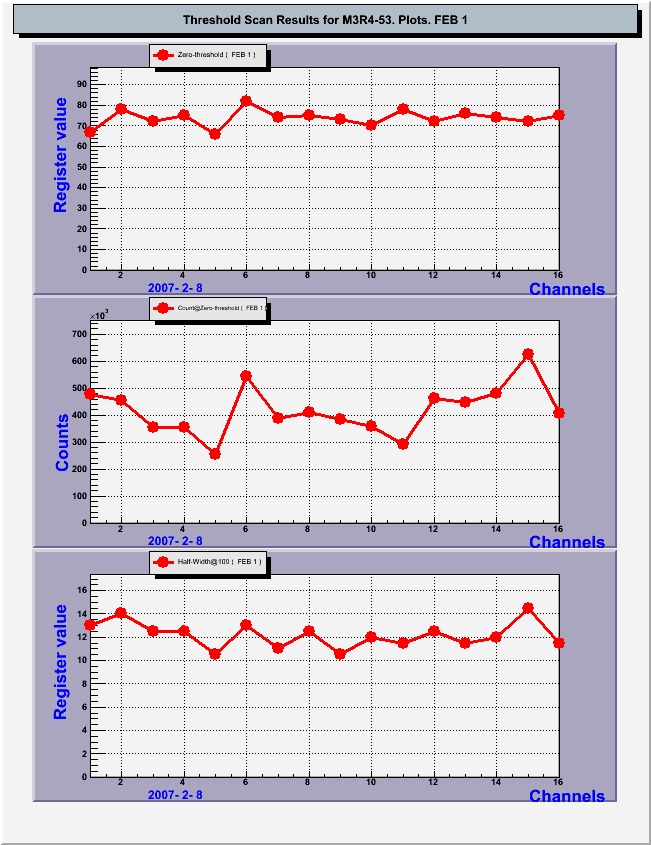
Test Date | Plots | Comments | 53 | 74 | 417958 | 13 | 79 | 442793 | 12 | 82 | 491346 | 12 | 08-FEB-07 | Sens=7.5mV/fc Th=15fc |
| FEB Channels |
Ch_1 | Ch_2 | Ch_3 | Ch_4 | Ch_5 | Ch_6 | Ch_7 | Ch_8 | Ch_9 | Ch_10 | Ch_11 | Ch_12 | Ch_13 | Ch_14 | Ch_15 | Ch_16 |
|---|---|---|---|---|---|---|---|---|---|---|---|---|---|---|---|---|
| FEB-1 | 67 | 78 | 72 | 75 | 66 | 82 | 74 | 75 | 73 | 70 | 78 | 72 | 76 | 74 | 72 | 75 |
| FEB-2 | 74 | 79 | 79 | 82 | 84 | 78 | 76 | 84 | 75 | 78 | 74 | 78 | 77 | 79 | 85 | 80 |
| FEB-3 | 86 | 82 | 83 | 84 | 80 | 81 | 85 | 80 | 80 | 83 | 81 | 83 | 81 | 84 | 82 | 77 |
| FEB Channels |
Ch_1 | Ch_2 | Ch_3 | Ch_4 | Ch_5 | Ch_6 | Ch_7 | Ch_8 | Ch_9 | Ch_10 | Ch_11 | Ch_12 | Ch_13 | Ch_14 | Ch_15 | Ch_16 |
|---|---|---|---|---|---|---|---|---|---|---|---|---|---|---|---|---|
| FEB-1 | 475196 | 455377 | 354429 | 353282 | 255188 | 542788 | 386823 | 411037 | 383467 | 357515 | 292156 | 460815 | 447236 | 480054 | 626228 | 405743 |
| FEB-2 | 397647 | 569750 | 577906 | 393730 | 335899 | 421951 | 424615 | 440498 | 347738 | 314421 | 471038 | 380946 | 498227 | 504728 | 548779 | 456822 |
| FEB-3 | 393844 | 452855 | 703162 | 402263 | 335825 | 428302 | 374245 | 432049 | 559634 | 531873 | 531513 | 400481 | 511549 | 563782 | 530685 | 709475 |
| FEB Channels |
Ch_1 | Ch_2 | Ch_3 | Ch_4 | Ch_5 | Ch_6 | Ch_7 | Ch_8 | Ch_9 | Ch_10 | Ch_11 | Ch_12 | Ch_13 | Ch_14 | Ch_15 | Ch_16 |
|---|---|---|---|---|---|---|---|---|---|---|---|---|---|---|---|---|
| FEB-1 | 13 | 14 | 13 | 13 | 11 | 13 | 11 | 13 | 11 | 12 | 12 | 13 | 12 | 12 | 15 | 12 |
| FEB-2 | 12 | 14 | 12 | 13 | 11 | 13 | 11 | 12 | 12 | 11 | 11 | 13 | 11 | 13 | 13 | 13 |
| FEB-3 | 11 | 13 | 13 | 12 | 11 | 12 | 11 | 13 | 10 | 14 | 11 | 12 | 14 | 13 | 14 | 13 |
 |
 |
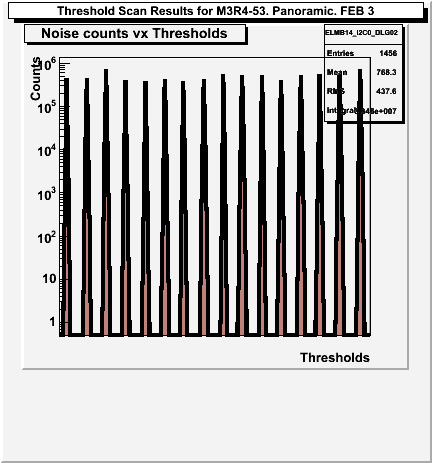 |
| Noise rates vs Thresholds for FEB-1 | Noise rates vs Thresholds for FEB-2 | Noise rates vs Thresholds for FEB-3 |
 |
 |
 |
| Scan results for FEB-1 (left plots), for FEB-2 (middle plots), for FEB-3 (right plots). Thr_Max vs channel number (upper plot) N_Max vs channel number (middle plot) D_100 vs channel number (lower plot) | ||
|---|---|---|